Table of Contents
Introduction
How Fan Performance Curves Work
Key Performance Metrics
System Impedance and Operating Point
The Affinity Laws: How Speed Affects Performance
Blade Design and Pitch Angle
Push-Pull Configurations for Restrictive Systems
Practical Fan Selection Guide
Summary
Frequently Asked Questions
References
1.Introduction
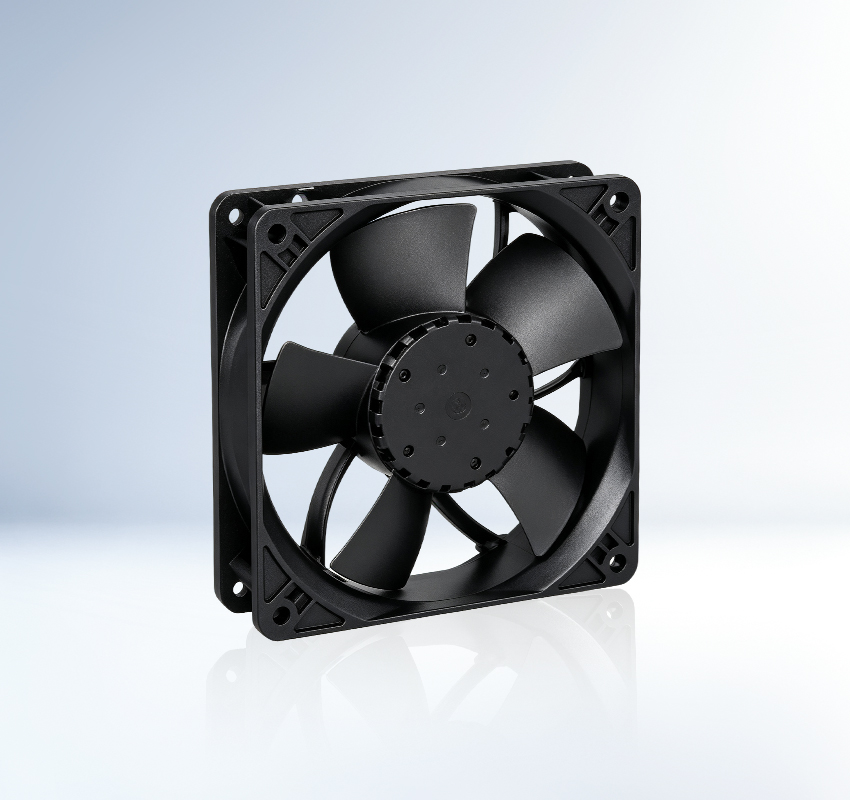
Selecting a DC compact fan based on frame size alone is one of the most common mistakes engineers make in thermal design. Two fans with identical 80 mm frames can deliver wildly different airflow, static pressure, and noise levels depending on blade design, motor speed, and bearing type. The only way to make an informed choice is to understand fan performance curves and how they interact with your specific system [1].
This article explains what performance curves tell you, how system impedance determines the actual operating point, and how the affinity laws govern the relationship between speed, airflow, pressure, and power. Whether you are cooling a server, a medical device, or a 3D printer, these principles will help you pick the right fan the first time.
2.How Fan Performance Curves Work

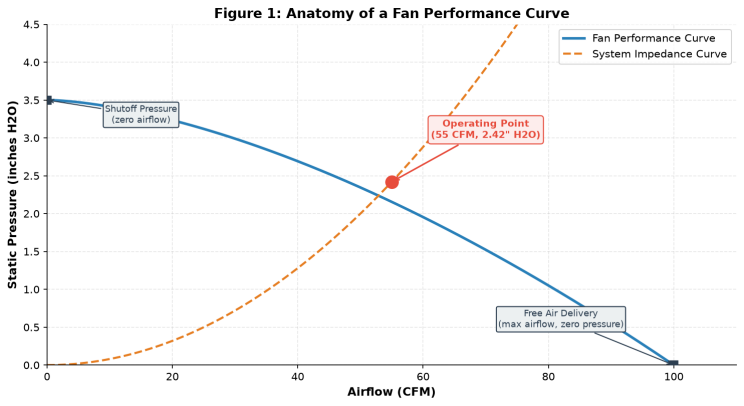
Figure 1: Anatomy of a fan performance curve showing the shutoff pressure, free air delivery point, and the intersection with the system impedance curve that defines the operating point.
A fan performance curve is a graph showing the relationship between airflow (horizontal axis) and static pressure (vertical axis). Every fan has one, and it is the single most important piece of information on the datasheet [4].
The curve starts at the shutoff pressure point on the left, where airflow is zero and static pressure is at its maximum. This is what the fan produces if you completely block the outlet. As airflow increases (moving right on the graph), static pressure drops. The far right end of the curve is the free air delivery point, where the fan moves maximum airflow with zero static pressure resistance [4].
The shape of the curve tells you a lot about the fan. A steep curve means the fan maintains good pressure even as airflow increases, which is desirable for systems with moderate impedance. A flatter curve means the fan delivers high peak airflow but loses pressure quickly when faced with resistance, making it better for low-impedance applications like open chassis ventilation [1].
3. Key Performance Metrics
Before diving deeper into curves, here are the four metrics that define DC compact fan performance and what they actually mean in practice.
Airflow (CFM or m3/h)
CFM (cubic feet per minute) measures the volume of air the fan can move. A typical 80 mm DC fan might be rated at 45 CFM, and a 120 mm model at 80 CFM or more. But this is the free-air maximum with zero resistance. Real-world airflow is always lower once system impedance is factored in [4].
Static Pressure (mmH2O or inches H2O)
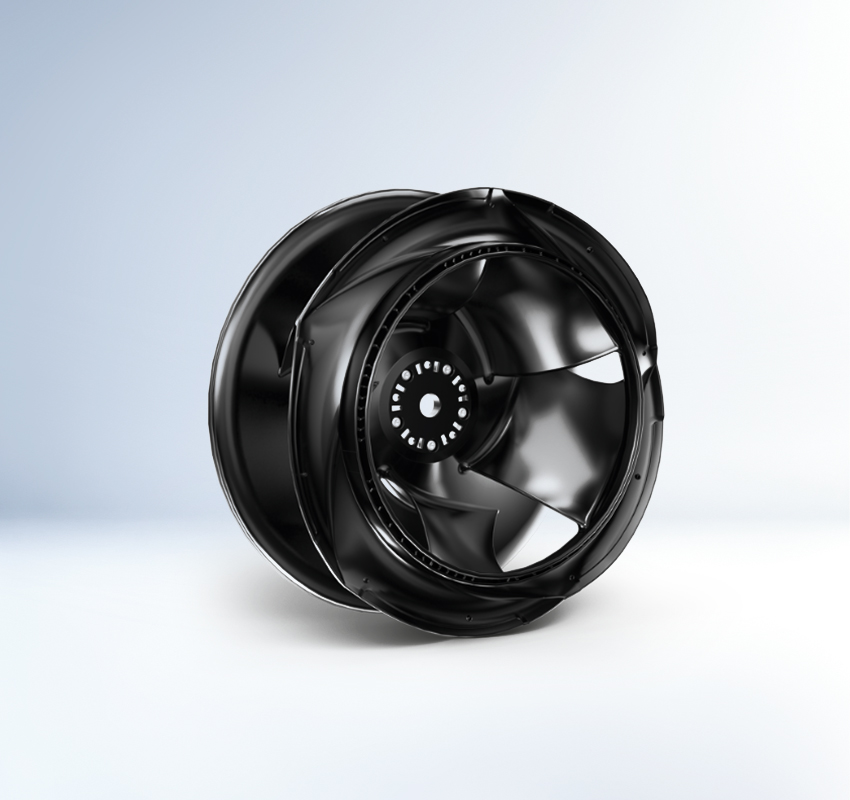
Static pressure measures the fan's ability to push air against resistance. A fan sitting behind a dense filter or pushing through a narrow channel needs high static pressure. A standard 40 mm axial fan might generate 0.15 inches H2O, while a centrifugal blower of the same size can produce 1.5 inches H2O or more [1].
Noise Level (dB(A))
Noise comes from motor/bearing hum and aerodynamic blade noise. At full speed, a 40 mm fan typically produces 18 to 22 dB(A), and a 120 mm fan 28 to 35 dB(A). Larger fans can deliver the same airflow at lower RPM, which is why they tend to be quieter. Bearing type also plays a role: ball bearings tend to be noisier than sleeve or magnetic levitation bearings, which is why manufacturers like Sunon have developed proprietary magnetic bearing designs with L10 life ratings exceeding 50,000 hours [2] [7].
Power Consumption (W)
DC compact fans draw anywhere from 0.5W for a 30 mm fan to 10W or more for high-performance 120 mm server fans. The U.S. Department of Energy notes that motor-driven systems represent roughly 70% of industrial electricity use, so even small efficiency gains compound across thousands of deployed units [6].
4. System Impedance and Operating Point

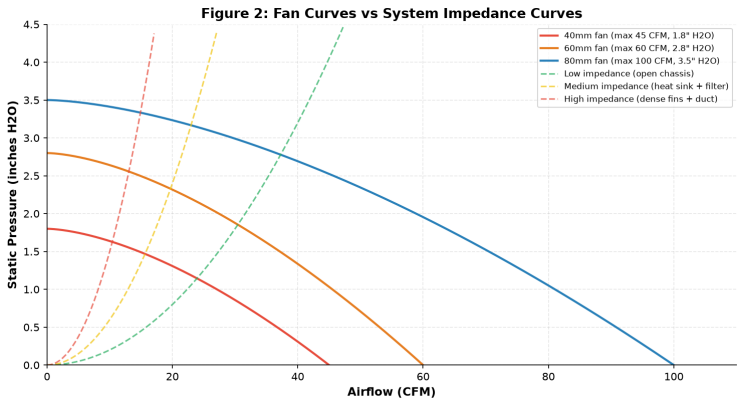
Figure 2: Multiple fan performance curves overlaid with three system impedance curves representing low, medium, and high resistance configurations.
Here is the part that trips up many engineers: the airflow number on a fan datasheet is not the airflow you will actually get. Real airflow depends on the system impedance, which is the resistance to airflow created by everything sitting in the air path: heat sink fins, filters, grilles, duct walls, and component layout [4].
System impedance follows a roughly parabolic curve. At low airflow, the resistance is small. As airflow increases, resistance grows with the square of the flow rate. The actual operating point is where the fan performance curve intersects the system impedance curve. This single point determines both the real airflow and the real static pressure in your system [1].
The practical implication: if your system has high impedance (dense heat sink fins, multiple filters, long narrow ducts), you need a fan with a steep performance curve and high static pressure, even if its peak CFM number is lower than a competing fan. A fan with 80 CFM free-air rating might deliver only 30 CFM in a high-impedance system, while a fan with 55 CFM free-air but higher static pressure might deliver 40 CFM in the same system [4].
AMCA-certified fan performance data ensures that the published curves are measured under standardized conditions and are comparable across manufacturers [4]. Always look for AMCA certification when comparing fans from different brands.
5. The Affinity Laws: How Speed Affects Performance

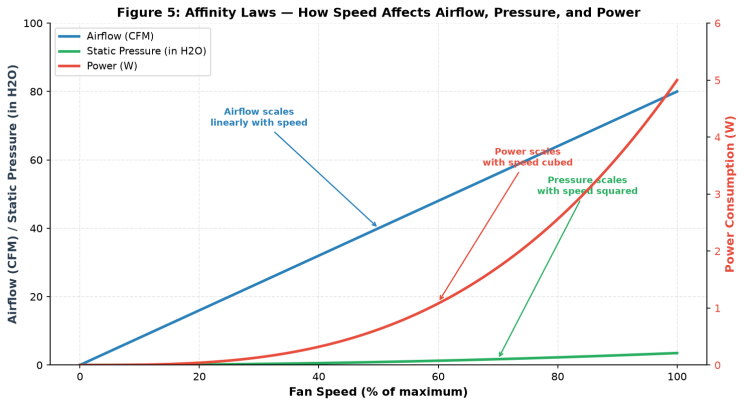
Figure 5: The affinity laws in action. Airflow scales linearly with speed, static pressure scales with the square of speed, and power scales with the cube of speed.
The affinity laws are three simple equations that govern how fans behave when you change speed. They are the foundation of fan performance engineering and explain why PWM speed control is so effective at saving energy [3].
The three affinity laws:
Airflow scales linearly with speed: 50% speed = 50% airflow
Static pressure scales with speed squared: 50% speed = 25% static pressure
Power scales with speed cubed: 50% speed = 12.5% power consumption
The power law is the important one. It means that reducing fan speed by half cuts power consumption to one-eighth. This is why PWM speed control on DC compact fans delivers such dramatic energy savings. A fan running at 70% speed uses only 34% of full-speed power, while still delivering 70% of maximum airflow [2].
This also explains why oversized fans are often a smart choice. A 120 mm fan running at 60% speed delivers the same airflow as an 80 mm fan at 100% speed, but at a fraction of the power consumption and noise. ASHRAE thermal guidelines for data centers specifically recommend variable-speed fan operation as a best practice for energy efficiency [5].
6. Blade Design and Pitch Angle

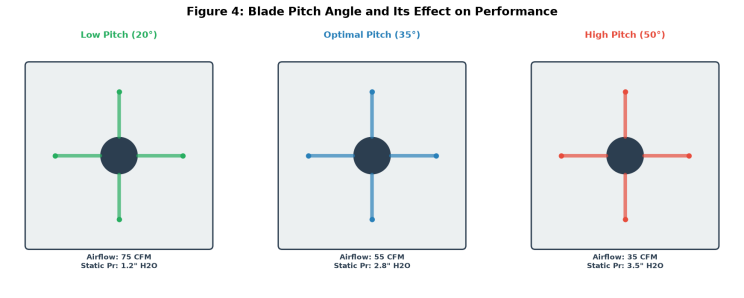
Figure 4: Three blade pitch angles and their effect on airflow and static pressure. Lower pitch favors airflow; higher pitch favors static pressure.
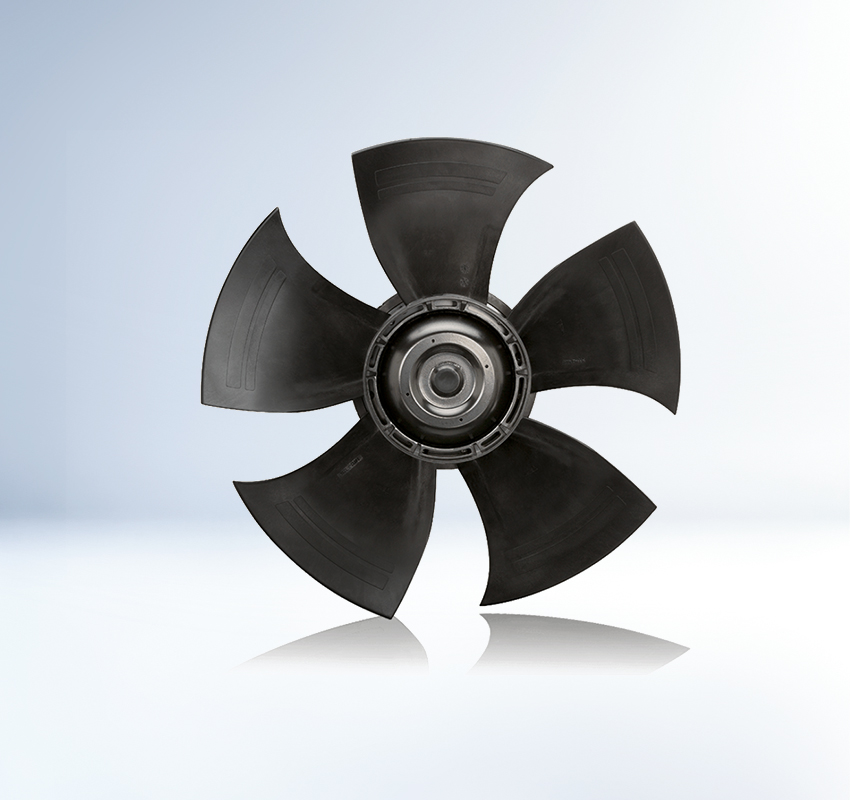
Blade design is where the art and science of fan engineering meet. The pitch angle, blade count, blade curvature, and tip clearance all affect the shape of the performance curve. Two fans with the same frame size and motor speed can deliver very different performance because of blade design alone [1].
Low Pitch Angle (20 to 25 degrees):
Moves more air at lower static pressure
Best for open chassis and low-impedance systems
Generally quieter at full speed
Loses airflow quickly when faced with resistanc
High Pitch Angle (40 to 55 degrees):
Generates higher static pressure at the cost of peak airflow
Better for systems with filters, dense heat sinks, or ducted airflow
Noisier at full speed due to higher blade loading
Maintains airflow better as system impedance increases [1]
Manufacturers like ebm-papst and Sanyo Denki offer different blade designs within the same frame size to address these trade-offs. Some datasheets list two versions: a high-airflow variant and a high-static-pressure variant. Choosing the right one requires knowing your system impedance [1].
7. Push-Pull Configurations for Restrictive Systems

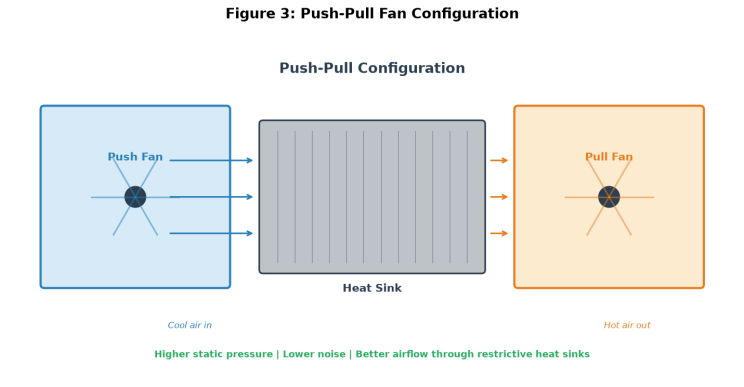
Figure 3: Push-pull fan configuration with one fan pushing cool air into the heat sink and a second fan pulling hot air out, doubling effective static pressure.
When a single fan cannot overcome system impedance, engineers use two fans in a push-pull arrangement: one fan on the inlet side pushing air in, and a second fan on the outlet side pulling air out. This effectively doubles the static pressure available across the restrictive element, typically a heat sink [1].
The benefits go beyond just doubling pressure. Push-pull configurations also reduce turbulence at the heat sink surface, create a more uniform airflow distribution across the fins, and can actually reduce overall system noise because each fan can run at a lower speed while maintaining the same net airflow [2].
In data center cooling, ASHRAE guidelines acknowledge push-pull arrangements as a valid strategy for high-density rack configurations where single-fan solutions cannot deliver sufficient airflow through dense server configurations [5].
When to consider push-pull:
System impedance curve is steep and the operating point gives insufficient airflow
The heat sink fin density is high (more than 20 fins per inch)
Multiple airflow restrictions exist in series (filter plus heat sink plus duct)
A single fan would need to run at 100% speed, creating excessive noise [4]
8. Practical Fan Selection Guide
Here is a step-by-step process for selecting a DC compact fan that will actually deliver the airflow your application needs.
Step 1: Estimate the thermal load.
Calculate the heat to be removed in watts and the maximum allowable temperature rise. A rough rule: 1 CFM removes about 1 to 1.5 watts with a 10 degree Celsius temperature rise. Add a 30 to 50% safety margin [4].
Step 2: Estimate system impedance.
If you have an existing prototype, measure the pressure drop across the system at the target airflow using a manometer. If not, estimate based on the components in the air path: open chassis is low impedance, heat sink plus filter is medium, dense fins plus long ducts is high [1].
Step 3: Plot the operating point.
Overlay your estimated system impedance curve on the fan performance curve from the datasheet. The intersection tells you the actual airflow and static pressure. If the airflow is below your requirement, you need a different fan or a push-pull configuration [4].
Step 4: Check noise and power.
If the fan needs to run at 100% speed to meet the airflow target, consider a larger fan running at lower speed. The affinity laws mean a 120 mm fan at 60% speed uses far less power and produces less noise than an 80 mm fan at 100% for the same airflow [2].
Step 5: Verify with testing.
Performance curves are measured under ideal lab conditions. Real installations with cables, brackets, and uneven air paths always perform worse. Build a prototype and measure actual temperatures and airflow. AMCA Standard 210 provides the testing framework that manufacturers use to generate certified performance data [4].
The IEEE has published research on BLDC motor efficiency that confirms the theoretical affinity law predictions hold true in practice, with less than 5% deviation across the operating range [3]. This means you can trust the affinity laws for design calculations.
9. Summary
DC compact fan airflow performance is defined by the interaction between the fan performance curve and the system impedance curve. The datasheet CFM number is the free-air maximum, not what you will get in a real system. Understanding the operating point, where these two curves intersect, is the key to selecting a fan that delivers the airflow your application actually needs.
The affinity laws govern everything: airflow scales linearly with speed, pressure with speed squared, and power with speed cubed. This is why PWM speed control on DC compact fans is so effective at reducing energy consumption and noise. Blade pitch angle determines whether a fan favors peak airflow or static pressure, and push-pull configurations can double effective pressure for restrictive systems. By following the five-step selection guide, engineers can avoid the common trap of undersizing fans and ending up with overheating products.
10. Frequently Asked Questions
Q1: What does CFM mean on a fan datasheet?
CFM stands for cubic feet per minute and represents the maximum volume of air the fan can move with zero static pressure resistance. In Europe and Asia, m3/h (cubic meters per hour) is used instead. The key thing to remember: CFM on the datasheet is the free-air maximum. Real-world airflow is always lower once system impedance from heat sinks, filters, and ducts is factored in [4].
Q2: How do I know if my system has high or low impedance?
Low impedance systems have open chassis or minimal airflow restrictions. Medium impedance includes a heat sink and possibly a filter. High impedance involves dense heat sink fins (more than 20 per inch), multiple filters, long narrow ducts, or sharp bends in the air path. If you have an existing prototype, you can measure pressure drop with a manometer at the target airflow [1].
Q3: Why does my fan deliver less airflow than the datasheet says?
Because the datasheet CFM is measured at zero static pressure (free air). In your system, the fan has to overcome impedance from heat sinks, filters, grilles, and duct walls. The actual airflow is the operating point where the fan curve intersects your system impedance curve, which is always lower than the free-air maximum [4].
Q4: Is a bigger fan always better for airflow?
Not always, but usually. A larger fan can deliver the same airflow at lower RPM, which means less noise and lower power consumption thanks to the affinity laws. However, a larger fan also requires more space and may have lower static pressure than a smaller centrifugal blower. The right choice depends on your system impedance and space constraints [2].
Q5: How much does reducing fan speed save in power?
A lot, thanks to the affinity laws. Power consumption scales with the cube of speed. Reducing speed to 80% cuts power to 51% of full-speed consumption. At 60% speed, power drops to just 22%. This is why PWM speed control on DC compact fans is so effective at reducing energy use, and why Energy Star recommends variable-speed fans for meeting idle power limits [8]. The DOE has identified this as one of the most cost-effective motor efficiency measures available [6].
11. References
[1] ebm-papst Group. DC Compact Fans: Performance Data and Selection Guide. Available at: https://www.ebm-papst.com.cn/en/
[2] Sanyo Denki. Sanace DC Fan Performance Specifications. Available at: https://products.sanyodenki.com/en/sanace/
[3] IEEE. Neethu, U. and Jisha, V.R. (2012). "Speed control of brushless DC motor: A comparative study." International Conference on Power, Signals, Controls and Computing (EPSCICON). Available at: https://standards.ieee.org/
[4] AMCA International. AMCA Standard 210: Laboratory Methods of Testing Fans for Ratings. Available at: https://amca.org/
[5] ASHRAE. Thermal Guidelines for Data Processing Environments. Available at: https://www.ashrae.org/
[6] U.S. Department of Energy. Motor Systems Energy Efficiency. Available at: https://www.energy.gov/eere/amo/motor-systems
[7] Sunon. DC Fan Bearing Technology and L10 Life Data. Available at: https://www.sunon.com/en/
[8] Energy Star. Energy Efficiency Guidelines for Electronic Equipment. Available at: https://www.energystar.gov/